Netflix is Adding Red Dead Redemption to its Gaming Catalog
Posted on December 19th, 2025
The addition of Red Dead Redemption to Netflix’s gaming catalog represents a meaningful moment in the evolution of mobile gaming and digital distribution.

Music Apps Data - How ASO Best Practices Keep Your App Competitive
The latest 2024 Music App Benchmarks Report from Business of Apps reveals just how fierce the competition has become in the music streaming category. Retention rates are slipping, user engagement is difficult to maintain past day one, and monthly subscriptions are outpacing annual plans in both renewals and reactivations. While industry giants like Spotify and Apple Music continue to dominate the space, the report’s findings show that even well-known apps are under pressure to adapt.
For app developers and marketers, this data is a call to action. If your app competes in the music or audio space, aligning your App Store Optimization (ASO) strategy with this performance data is critical. Visibility, conversion, and long-term engagement all begin with how your app appears in the store. The latest benchmarks make it clear: surviving in this space means optimizing every step of the user acquisition funnel.

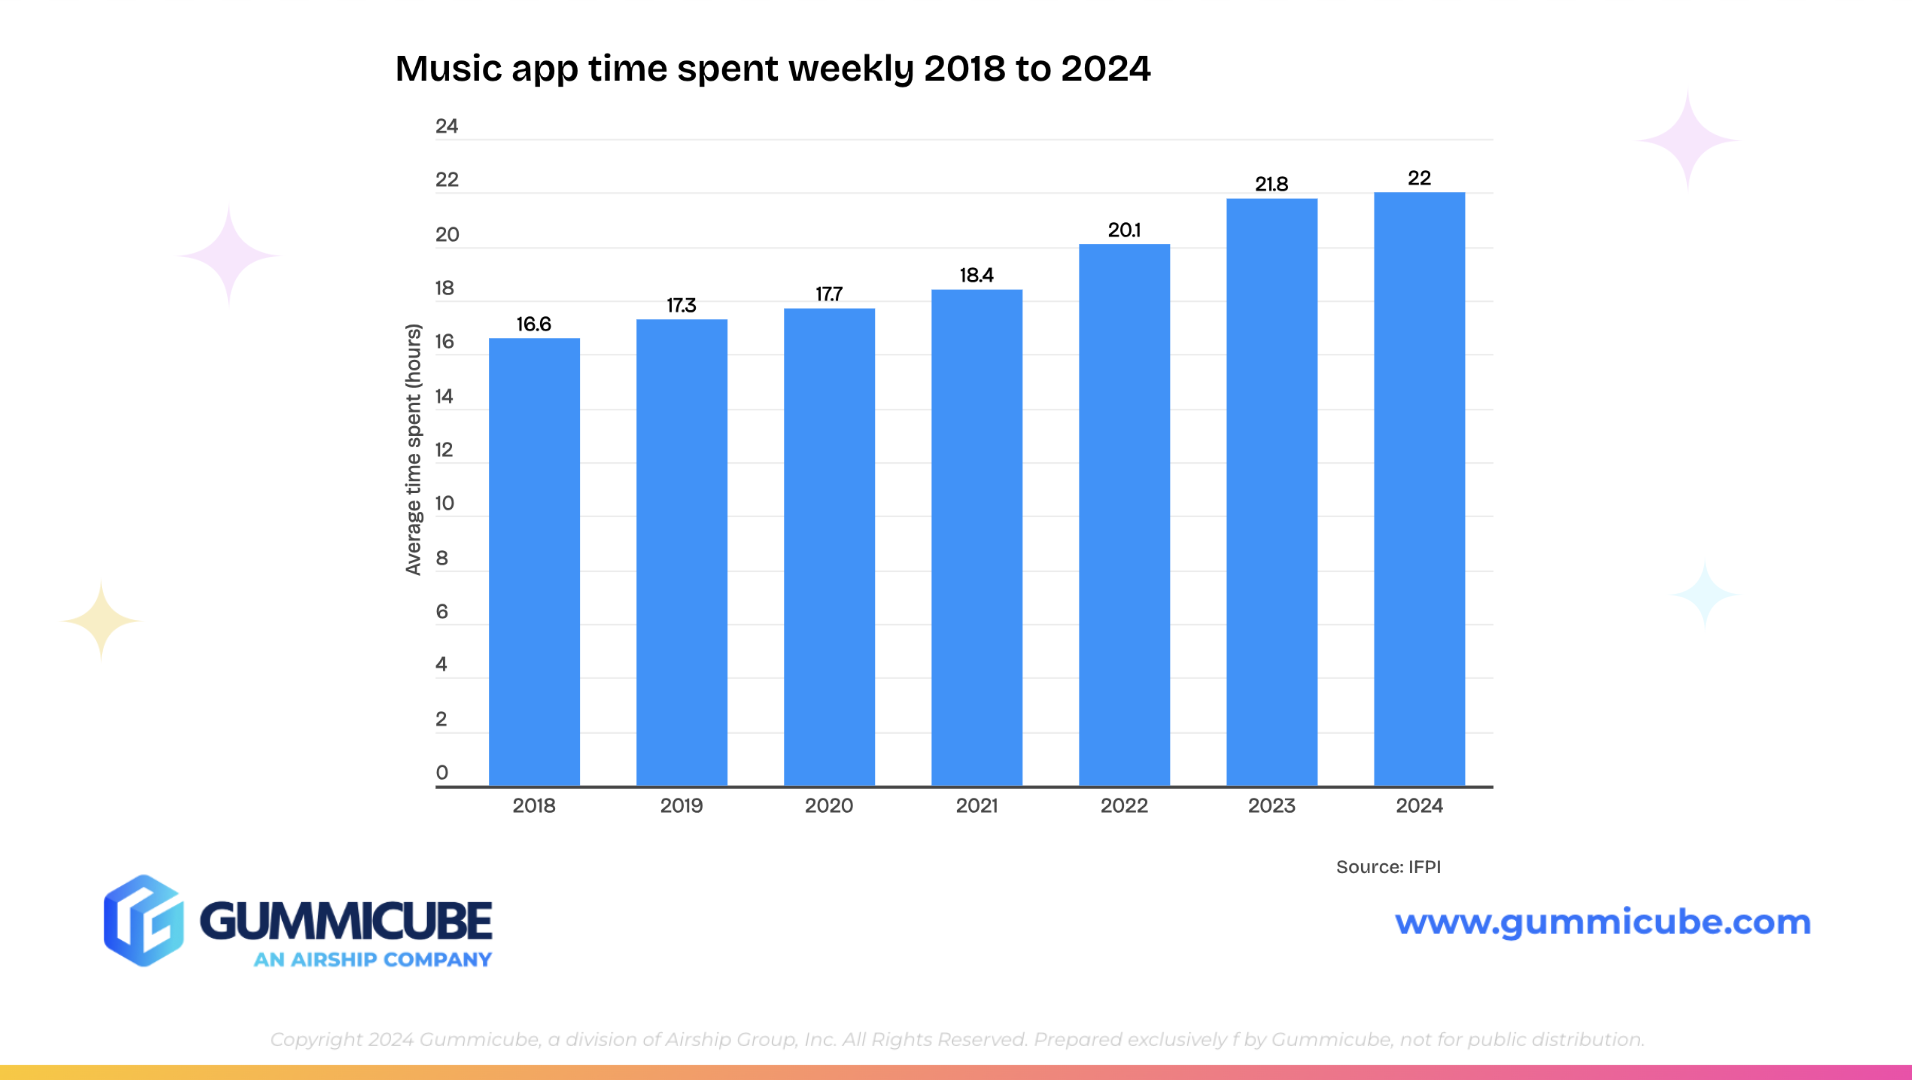
Let’s take a look at some of the most revealing statistics from the 2024 Music App Benchmarks Report. Each metric provides insights that can shape how your app competes in the store environment.
These numbers are new performance standards for any music app trying to compete. If your metrics are lower than these averages, that is a signal that your app store listing may not be setting the right expectations or communicating value clearly enough. And if you are meeting or beating these averages, there is still room to optimize, especially as user behavior shifts and competition grows.
Performance metrics like app retention and conversion rates are not just internal KPIs. They influence how your app is ranked, how it is featured, and how visible it is in search results. In short, they can affect how well your ASO strategy works.
If your app has a strong onboarding flow, but your activation rate is below 19.2% on day one, users may not be finding what they expected after downloading. That disconnect likely began in your app store listing. Either your screenshots did not match the in-app experience, or your app description did not communicate the real benefits clearly enough.
Likewise, if your iOS conversion rate is significantly below the 47.1% benchmark, your creatives or metadata might not be compelling enough to earn a download. Since iOS users are converting at a higher rate on average, there is an opportunity to test stronger value propositions, different messaging, or more effective screenshot designs.
Staying informed on this kind of performance data helps you shape your ASO decisions around what is working in your category. It also helps you identify gaps in your app store strategy and build a roadmap for ongoing improvement.
Using the music app benchmarks as a lens, here are the most important ASO best practices that can help you compete, convert, and retain new users in this app category.
At its core, ASO begins with keyword optimization. Your app’s visibility depends on how well your title, subtitle, and keyword bank (on iOS) or your title and descriptions (on Google Play) align with what users are actually searching for.
For music apps, DATACUBE shows that high-volume keywords you could include are:
You need real data to understand which terms are driving impressions and downloads. ASO tools that show you real-time data will be a game changer in creating a strategic plan for your app store listing. Keep a close eye on keyword performance and adjust your strategy regularly. Music trends can shift quickly, and the terms users search for today may look very different just a few months from now.
Consider keywords that reflect specific features, genres, or moods. These can often have lower competition and higher intent, helping you capture more engaged users.
Your app’s visuals are often the deciding factor between a user tapping “Download” or moving on to another app. Creative elements (app screenshots, icons, and app store videos) need to look polished and convey key app features seamlessly in order to set you up for a better chance at boosting your app conversion rates.
According to the 2024 Music Report, iOS apps in the music category convert at a much higher rate than those on Google Play. This may be due in part to stronger visual storytelling on iOS listings.
Here’s how to make sure your creatives are working for you:
Users in this category have high expectations. They have likely used one or more music apps before. If your listing feels generic, they will not take a chance on it.
Every ASO strategy should include regular testing of both metadata and creative assets. Even small changes with an updated screenshot headline in the first screenshot or a new call to action can improve conversion rates significantly over time.
A/B testing tools available through Apple’s Product Page Optimization and Google Play’s Store Listing Experiments allow you to test variations of your app’s visuals and messaging with real users.
Here are examples of what to test:
Apps that test regularly tend to outperform apps that do not. Testing is where real optimization happens, and it is the only way to keep improving your performance metrics.
One of the clearest takeaways from the 2024 report is the performance gap between iOS and Google Play apps. This suggests that user behavior differs significantly between platforms.
Your ASO strategy should reflect those differences. What works on iOS might not resonate with Android users, and vice versa. For example, iOS users may be more open to premium subscription messaging, while Android users may respond better to value-focused positioning.
Use Apple’s Custom Product Pages and Google Play’s custom store listings to tailor your messaging, visuals, and calls to action to each audience. Customize listings by acquisition source as well. Users coming from social ads may need a different message than those arriving from organic search.
Ignoring these platform nuances means missing out on performance gains that come from personalized optimization.
The 2024 Music App Benchmarks Report is not just an industry update. It is a roadmap for what your ASO strategy should address next. The metrics provide real-world signals on how users are behaving across platforms, how they are responding to subscription models, and how well apps are converting store views into loyal users.
Whether you are launching a new music app or refining an existing one, this data is too important to ignore. The margin for error is small, and users have plenty of alternatives. If your listing does not capture attention, communicate value clearly, and deliver a trustworthy experience, users will look elsewhere.
ASO is how you close that gap. By optimizing keywords, testing visuals, and tailoring your strategy by platform, you increase your odds of standing out in a crowded marketplace. You also ensure that the quality of your app is reflected in every element of your store presence.
Music apps are under more pressure than ever to perform. With the right data and the right ASO strategy, your app can rise above the noise.
If you are looking for expert guidance in optimizing your app store presence, Gummicube’s ASO services are here to help. Our team uses real mobile data to craft strategies that can increase app store conversion rates, improve app retention, and support your long-term growth goals. Whether you need a full ASO strategy or a fresh round of app creatives to mobile app A/B test, we are ready to partner with you.
Let’s talk about how your music app can reach its full potential.

The addition of Red Dead Redemption to Netflix’s gaming catalog represents a meaningful moment in the evolution of mobile gaming and digital distribution.

App developers have a limited window to identify wake lock issues, strengthen their performance, & protect their long-term visibility in the Google Play Store.

Developers should focus on regular ASO, A/B testing, and clear communication of an app's value as LLMs learn and recommend apps based on queries.