Mobile App Retention Metrics
December 29th, 2015
 Tagged: App-Analytics, Mobile-App-News, Mobile-Marketing, Tips, User-Acquisition
By Anh Nguyen
COO & Co-Founder at Gummicube, Inc
We have written extensively on this blog about acquiring organic traffic, mobile app visibility and converting app store views to installs and users. One of the key drivers of the value of these users is how long a user keeps using your app - mobile app retention.
Retention metrics you should be using
Many of the metrics used to track app retention are associated or impacted by changes to engagement - meaning, a measurable improvement in user engagement will often improve retention as well. If retention measures - at a high level - the longevity of product use, engagement measures the depth of product use. Retention metrics such as cohort-based Day 1, 3, 7, 14, 30 and 90 can help us determine if efforts to keep users coming back are having a positive effect. Local and push notifications are the tools of choice for many mobile app marketers, but don’t discount great design and perceived value. Engagement metrics, therefore, provide the insights for improving retention. What are users engaging with inside of the app, what are they missing and how can we provide more of what they want, or even encourage use of where we think the value is?
Retention metrics examples
Setting key performance indicators (KPIs) for a mobile app should be tied to business goals. There is not a mobile app template for all mobile apps as Clash of Clans and the Target app are very different with different goals and different ways of measuring the revenue generated from the mobile app. They really only share a platform (mobile OS and a mobile device). Assuming goals are tied to revenue, and by extension lifetime value (LTV), finding the cohort that demonstrates the highest LTV informs the rest of the mobile app’s KPIs including retention. Because retention metrics don’t provide a detailed view of in-app activity (that usually falls under engagement), more (longer) is almost always associated with a higher LTV. Overall for both Android and iOS apps across all categories - D30 retention tends to be 25-40% of D0 users, with a mere 1-4% at the end of a year (D365).
Mobile app retention statistics
The most common method for tracking retention is Day N retention. What percent of your users opened the app on Day N? If you have 100 installs on January 1st, 40 open the app Jan 2nd and 20 open the app Jan 8th - for the Jan 1 cohort, your D1 is 40% and D7 is 20%. Mobile app marketers can look at aggregate data, but reviewing by cohorts tied to new versions or other retention optimization efforts will provide the insights you need to measure the effectiveness of such efforts.
Attrition metrics
A key SaaS metric is churn. Churn measures what percent of users stop using (and paying for) an app (or service) for a given month. Consider a scenario where a business has 100 active users paying monthly, are signing up 10 new customers per month, and have a 10% churn rate. Even with 10% monthly new customer growth, the business is flat as they are losing 10% of existing customers to churn. The subscription model in mobile apps has not yet become a prominent monetization model with only a few standouts including Pandora, Spotify, HBO, Kylie Jenner’s app. Most apps are free to play, with some small percent of total users purchasing in-app items. An even smaller percent of users account for the majority of revenue in most apps with some studies showing 60% of revenues coming from only 10% of users. What that means for attrition metrics for mobile apps is it is easy to dismiss users that churn as those unlikely to make an in-app purchase. This may be true - but really depends on the type of mobile app. Shopping apps specifically should have a much longer goals for retaining users than a mobile game for example. The trend by cohort analysis on D90 retention for non-gaming apps should be a primary attrition metric. Target and Lowes both shared that customers with their mobile app installed shopped more frequently and purchased more per visit than non-app users. Keeping these users on your app for 90 or 365 days can have a big impact on store revenues - where many games are making money on Day 1 and much less per user on D90.
Tracking retention
The most popular free and paid app analytics services all have default retention tracking. Apple’s analytics module tracks retention for iOS apps, but not Android. Flurry provides a good, free solution and then Localytics and Mixpanel have complete app analytics offerings. Improved retention usually means improved LTV, which makes each new acquired user more valuable and allows for increased investment in both paid and organic user acquisition efforts.
More blog-posts like this:
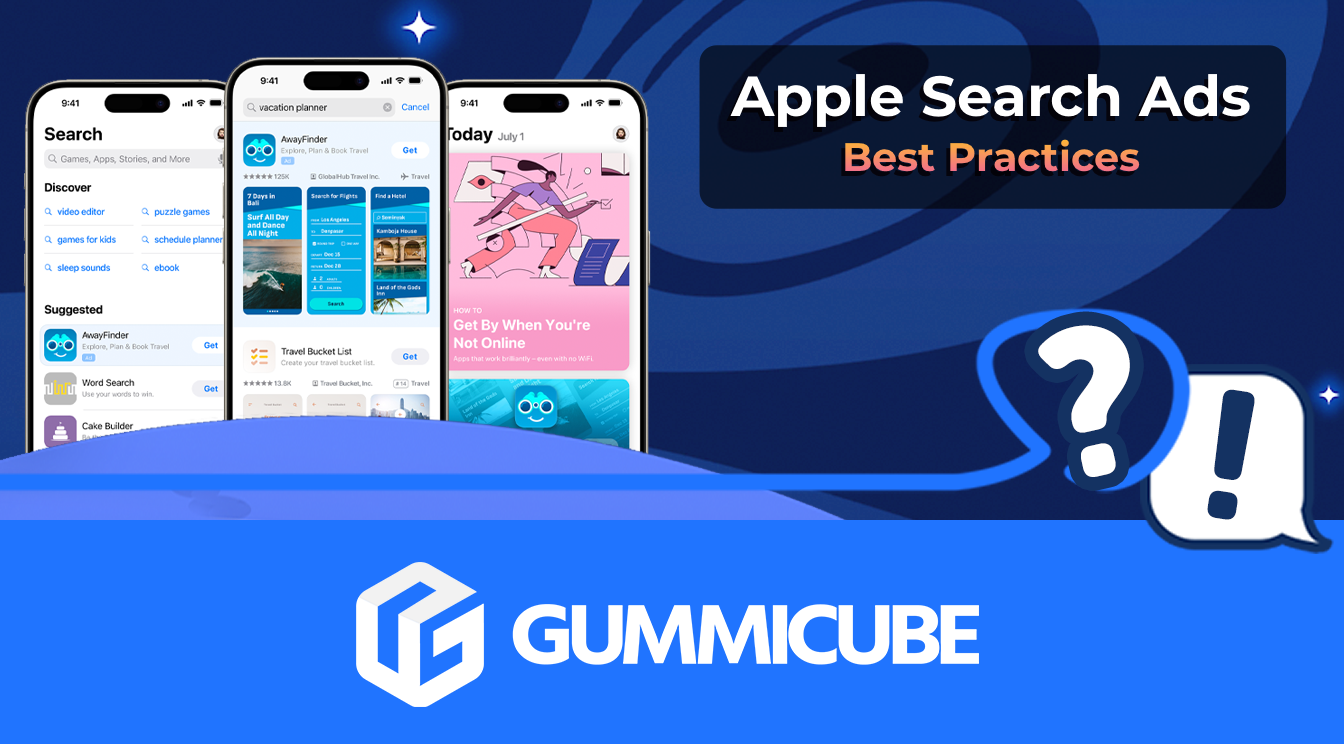
5 Best Practices for Apple Search Ads
Are you leveraging Apple Search Ads the right way? Take a look at these recommendations to optimize your paid campaigns and target the right users.
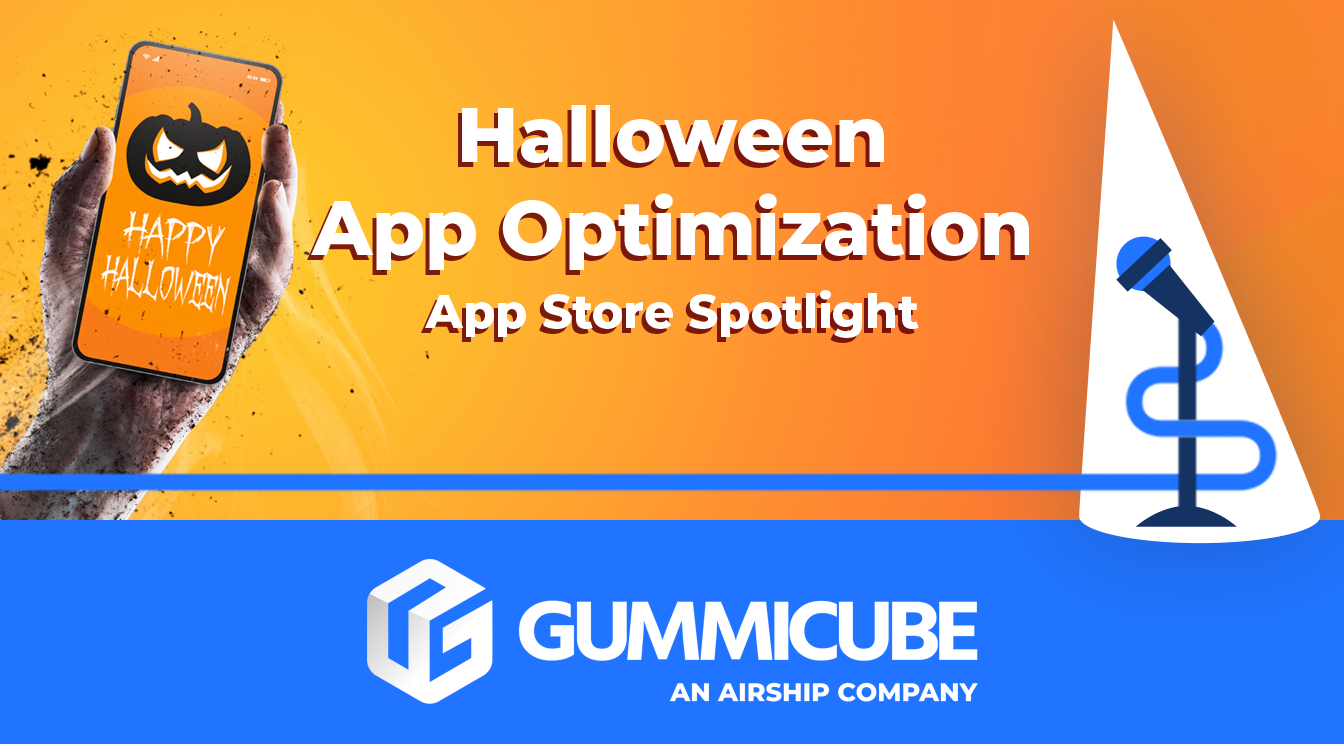
Halloween App Optimization - App Store Spotlight
Ghostly happenings are among us... and in your app listing too? If you aren't leveraging the power of app seasonality to make relevant tweaks to your store listing you're leaving precious engagement and conversions on the table.
App Store Connect Holiday Schedule 2021
Developers on the iOS App Store should plan in advance of the upcoming Holiday Schedule to allow enough time for apps to get approved during the busy holidays.